Forecasting and Scenario AnalysisKnow exactly how you'll hit your target

Forecast your emissions forward, test the scenarios, and get a project plan you can take to your board.
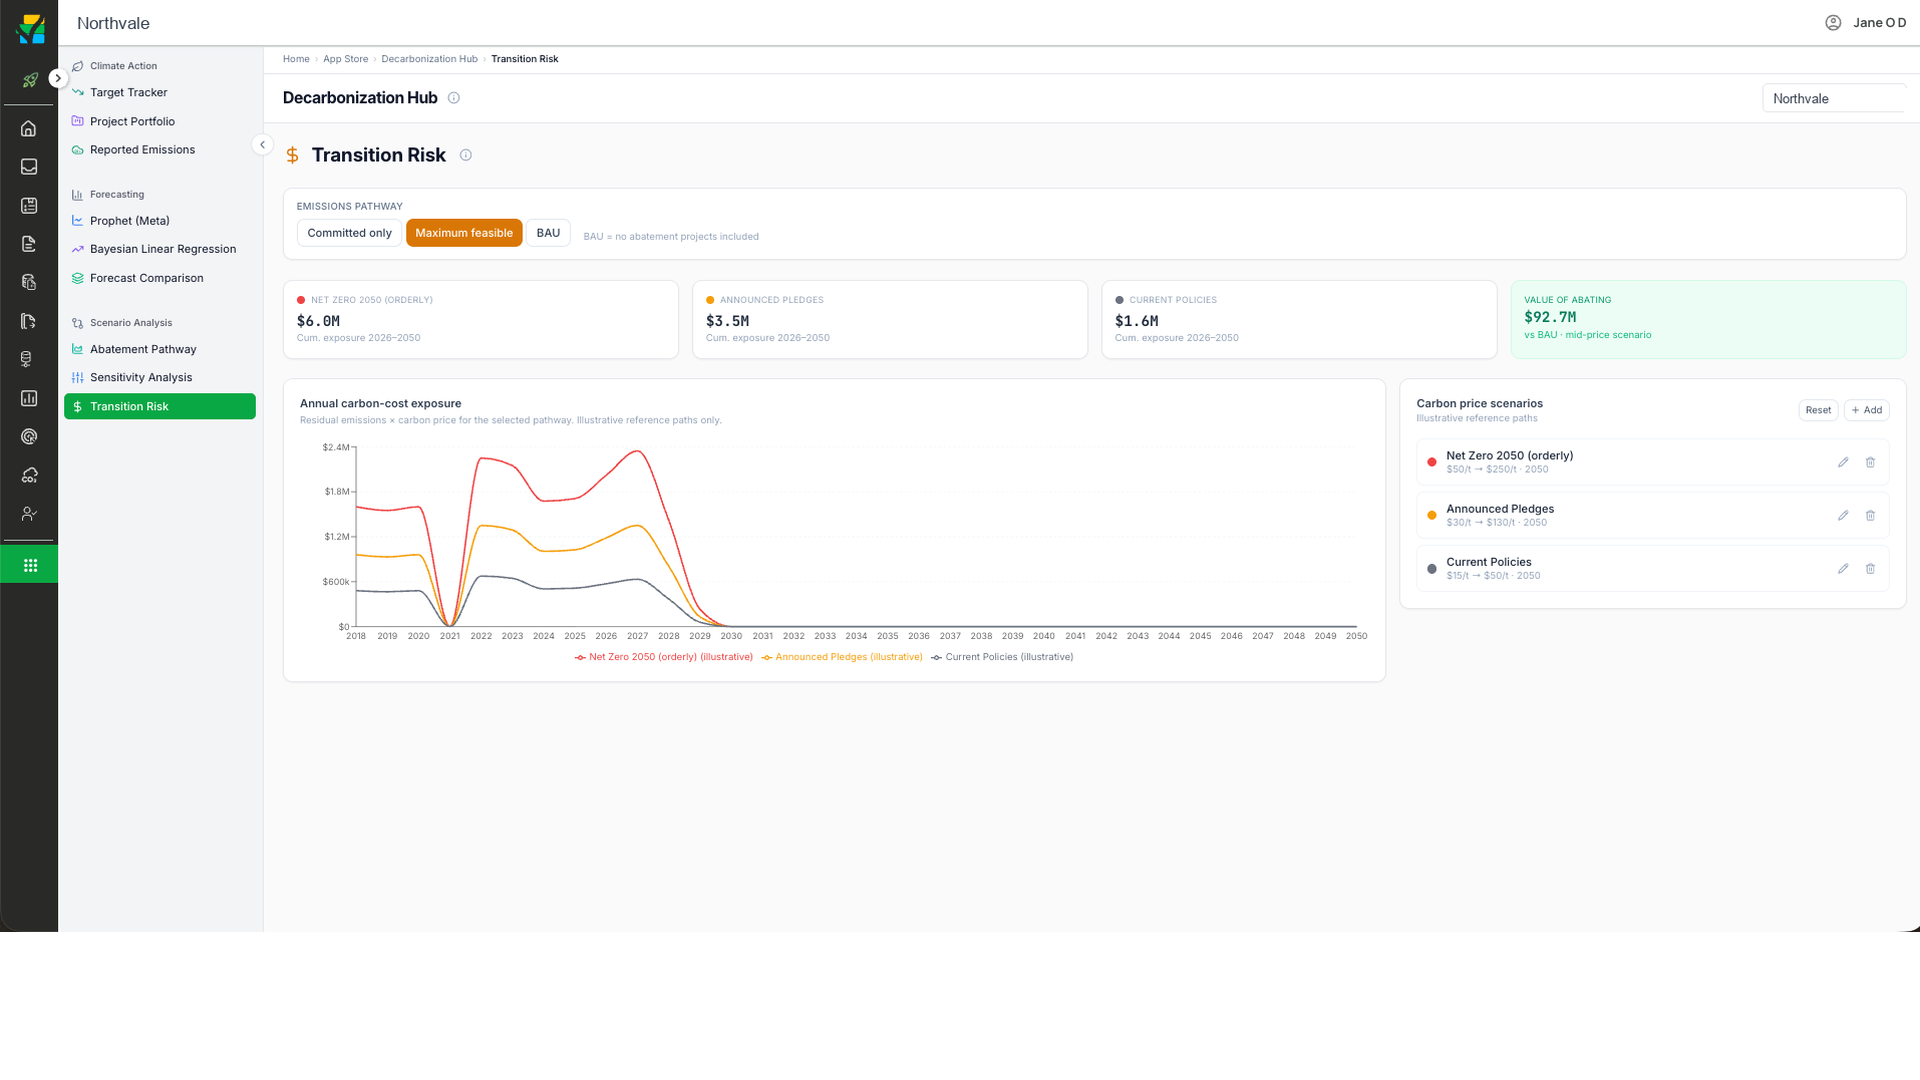
Pulsora transition risk showing cumulative carbon cost exposure under net zero, announced pledges and current policy scenarios
Forecast Comparison

Two forecasting methods run side by side, and their agreement is the confidence signal

Prophet and Bayesian regression are applied to the same history. One is suited to seasonal patterns and the other to limited data. Where the two come out close together, the page reports a consensus and rates the forecast more reliable.
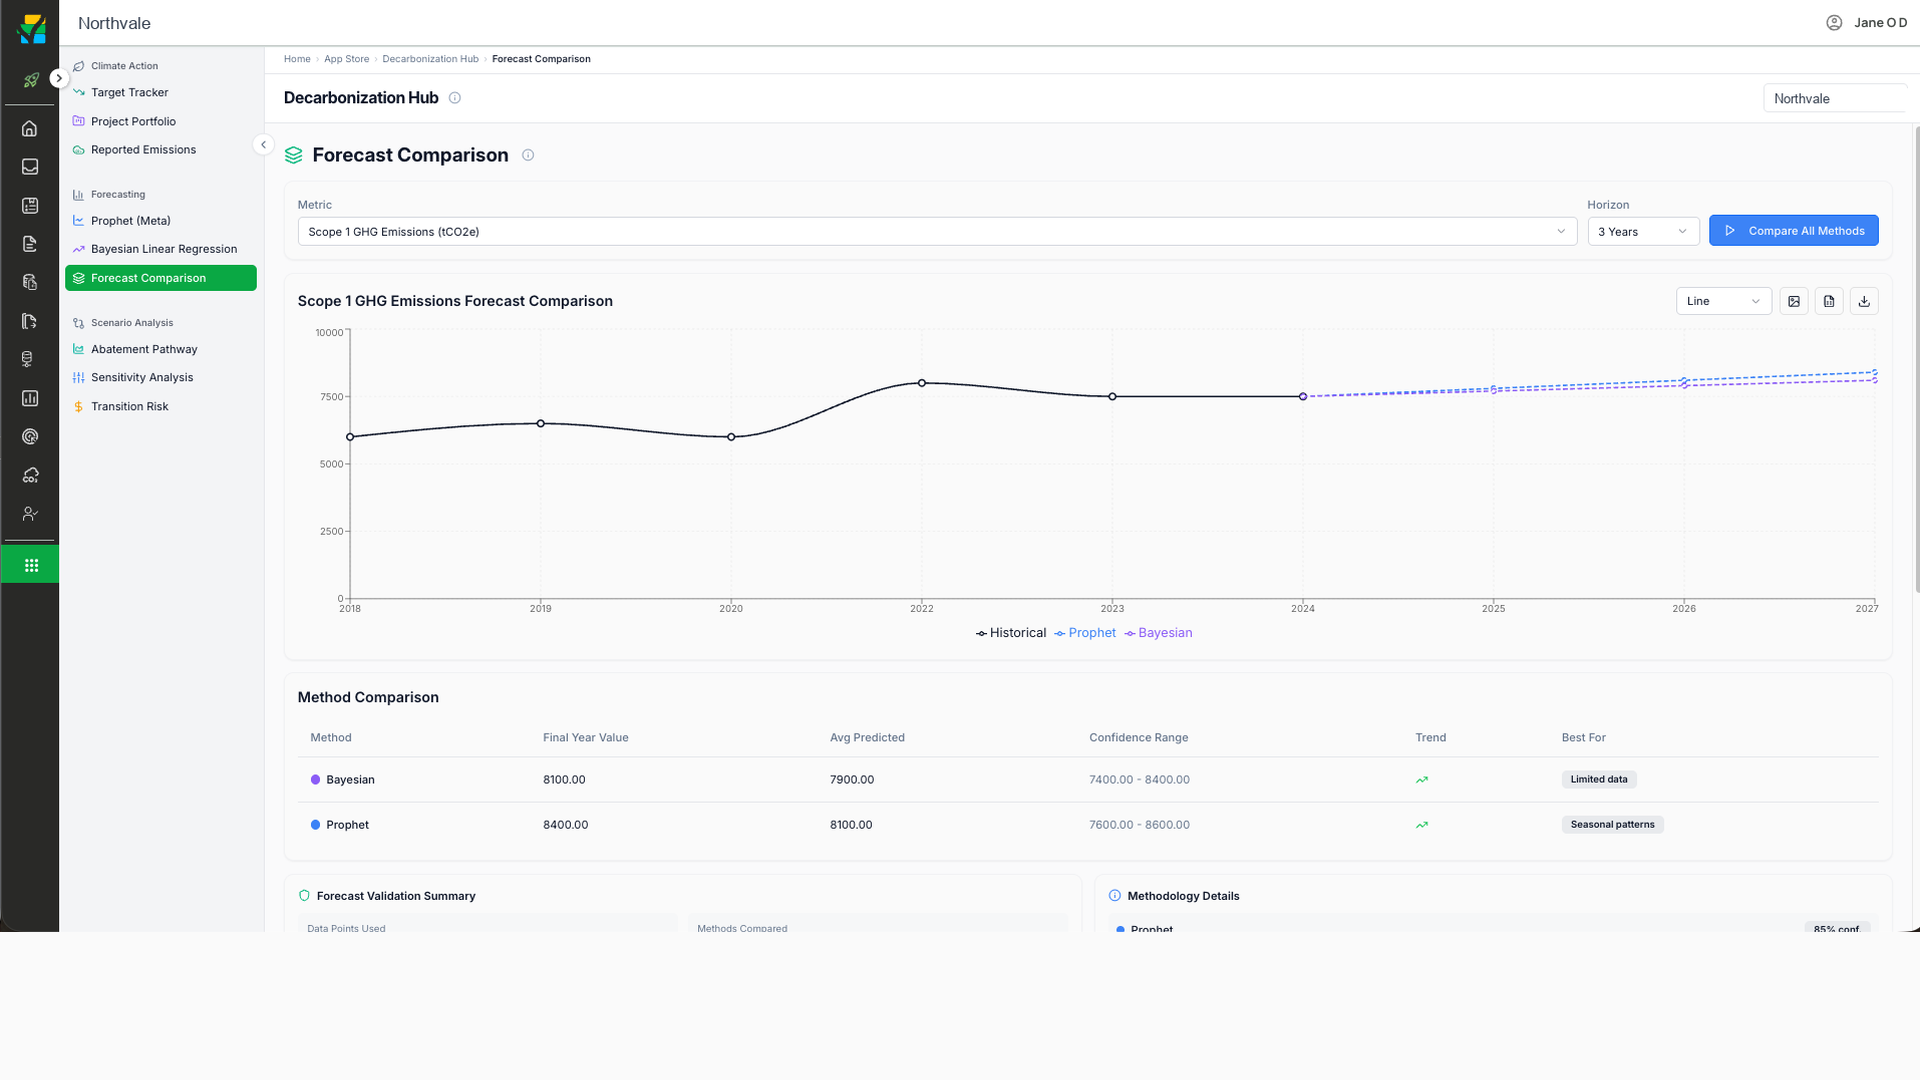
Pulsora forecast comparison of Prophet and Bayesian emissions projections with confidence ranges
Sensitivity and Stress Test

Which assumption changes the 2050 number most

Four drivers can be set by hand: output growth, project delivery, project delay and autonomous improvement. The tornado chart ranks them by how far each one alone shifts 2050 net emissions. You then know which assumption to check first.
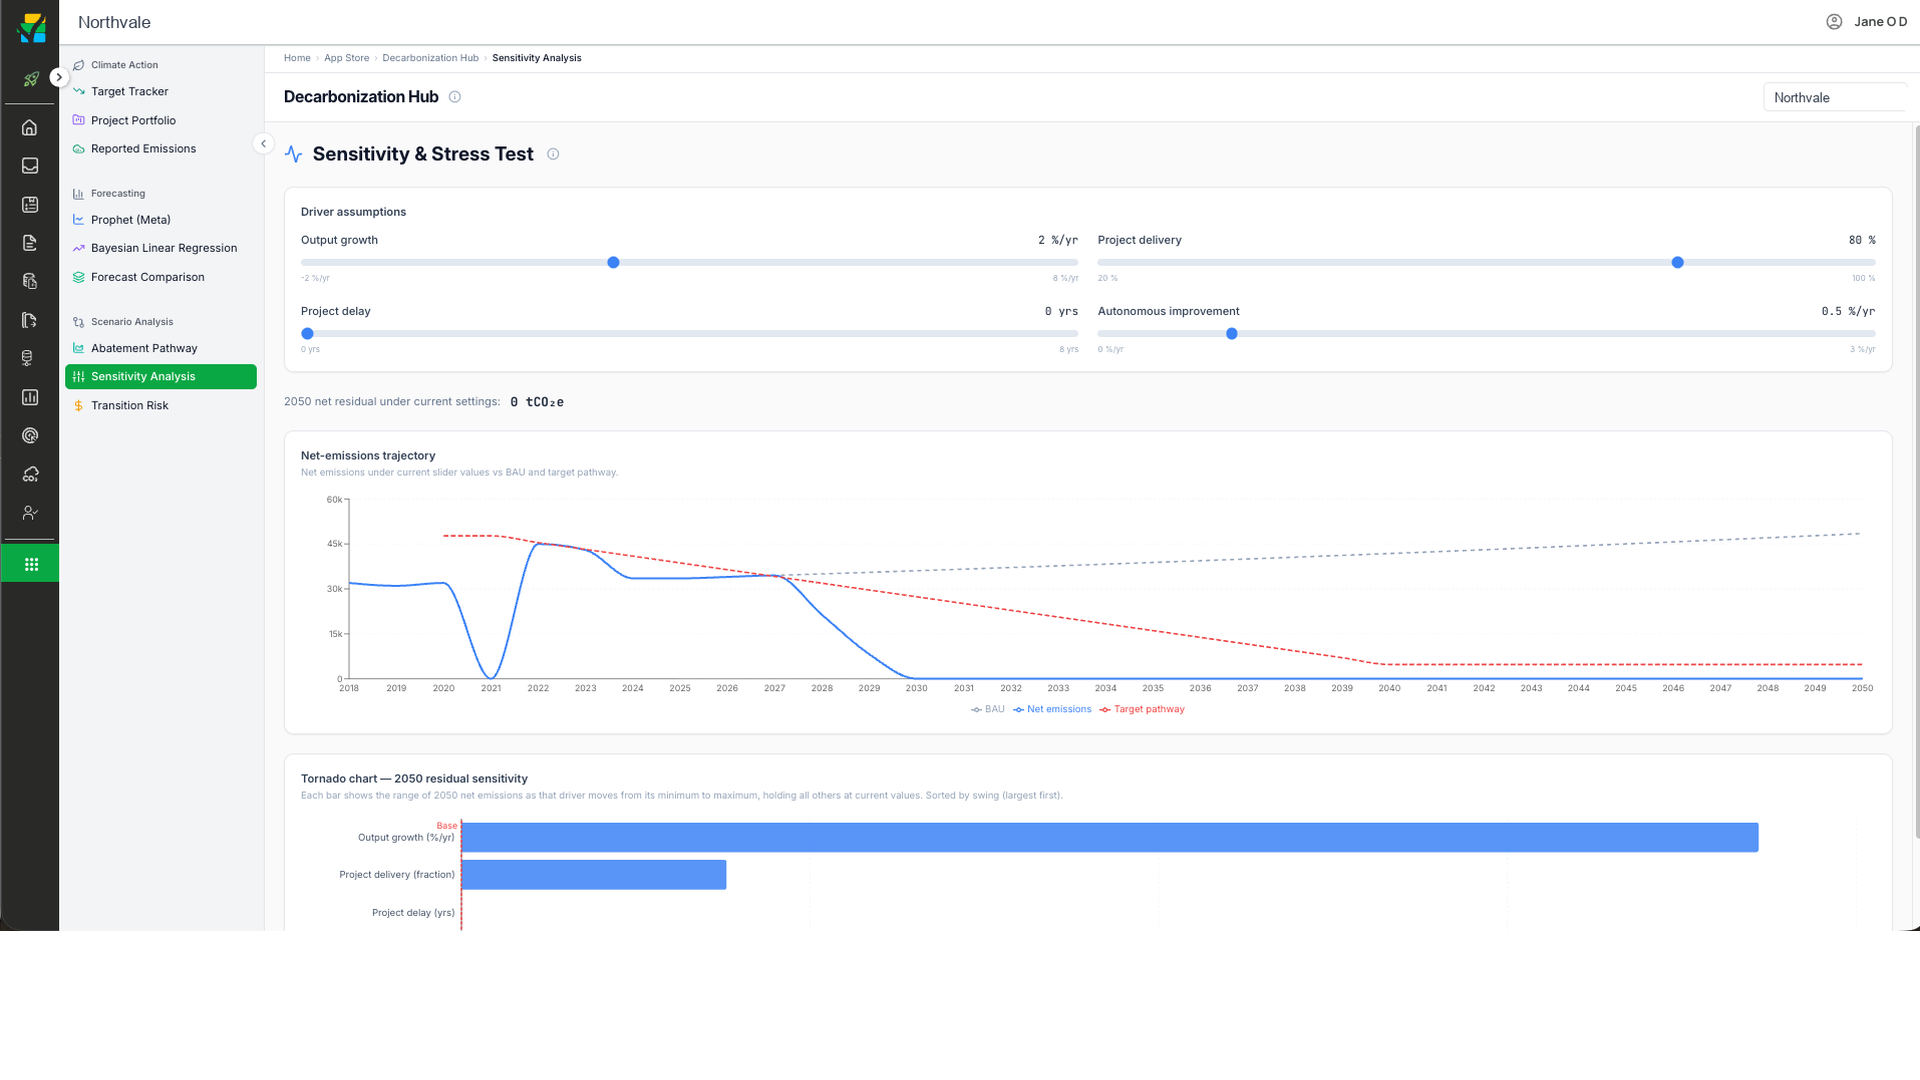
Pulsora sensitivity and stress test with driver assumption sliders and a tornado chart of 2050 residual emissions

Forecasts from your real history

Forecasting extends from your actual history in Pulsora, not a generic curve, so the projection reflects your real trajectory.

Three ways to look ahead

Abatement pathway, sensitivity analysis, and transition risk, each answering a different question your analysts ask.

A portfolio you can defend

Projects rank by abatement and levelized cost, cheapest first, each with a citation for why it was suggested.

Model the levers

Adjust carbon price and business-as-usual growth, and watch residual emissions, gap to target, and cumulative abatement respond.

Şişecam runs its sustainability reporting on Pulsora
100
facilities
45
plants across 14 countries
450+
metrics standardized
17
teams
Read the Şişecam story →

A projection your board can challenge

Forecasting runs on Pulsora's Context Graph, the layer that connects your reporting boundary, facilities, emission sources, frameworks, supplier data and audit history. The projection extends from your own measured history rather than a generic curve, so every number in the plan traces back to the record it came from.

Modeled to your targets

Emissions pathways modeled against SBTi and regulatory targets.

Tested before you commit

Transition scenarios simulated while the plan is still a draft.

Set against your peers

The projection is benchmarked against your peers, so you know where you stand.

Governance

Your forecast data stays yours

Forecasting runs on your own historical data to model scenarios. That data stays in your control.

Private by default

Your data and the scenarios you model are never shared, published, or used to train any model.

Encrypted and controlled

Every record moves over TLS 1.2 or greater inside SOC 2 controlled infrastructure.

Traceable to the inputs

Each projection links back to the historical data behind it, so the forecast is defensible.

Forecasting FAQ

What does Forecasting project?

Your carbon trajectory and ESG performance forward, based on your real history.

Can I compare to peers?

Yes. The projection is benchmarked against your peers so you know where you stand.

Can I test scenarios?

Yes. You can try scenarios and see the outcome before you commit to a plan.

Can I try Forecasting before I buy?

Yes. You can try Pulsora AI free for 14 days.

See where your trajectory leads.

Start your free trial