Short answer: Boards expect scrutiny of environmental, social and governance (ESG) performance to continue, and directors say they need more specific data to respond to it. In a March 2024 survey of 801 board members by Diligent and Spencer Stuart, nearly 96% expected a continued or stronger focus on ESG over the next five years. Sustainability leaders can help meet that expectation by bringing a peer comparison to the board before anyone asks for one, with every value traceable to a public source.
Board readiness in one line: Directors expect ESG scrutiny to continue (Diligent and Spencer Stuart, 2024), and investors report gaps in the ESG data they use (Morningstar Sustainalytics, 2026).
If a director asks at your next meeting how your emissions compare with your closest peers, you either have the comparison ready or you promise to come back with it. The evidence below shows why directors and investors are likely to ask, and what a prepared answer needs.
1. Boards expect ESG scrutiny to continue, and competing priorities are the obstacle they name most
Diligent and Spencer Stuart surveyed 801 board members in March 2024, across public, private and pre-IPO companies in 14 industries. Nearly 96% expected a continued or stronger focus on ESG over the next five years [1]. Only 3% named public backlash as a major obstacle, and 4% said backlash had led their organization to abandon or dial back its ESG efforts [1].
The obstacle named most often sat inside the company. Almost 25% of respondents put competing business or strategic interests first among the barriers to putting an ESG strategy into practice [1]. The report also found that directors are looking for more specific data and insights on the material issues facing their companies [1].
The Diligent survey is from 2024. It shows what boards expected then, and it does not measure how ready they are today.
2. Boards add about 0.8 directors a year, so new expertise reaches them slowly
Spencer Stuart's 2025 U.S. Board Index found that S&P 500 boards averaged 0.8 new directors each in 2025. The 418 directors who left S&P 500 boards that year had served an average of 11.6 years [2].
The index also cites a separate Spencer Stuart survey of CEOs, run in November and December 2024, which asked about expertise in general, not ESG in particular. In that survey, 53% of CEOs said they ideally want directors with subject-matter expertise aligned with the company's most pressing issues. Only 43% of CEOs felt their boards delivered that, compared with 63% of directors [2].
A board that wants a director with ESG expertise competes with every other skill it wants to add, and on average it adds fewer than one director a year. A new seat is only one route to expertise. Outside advisers and director education do not wait for a seat to open. Data prepared in advance does not wait either.
3. Investors already report gaps in the ESG data they use
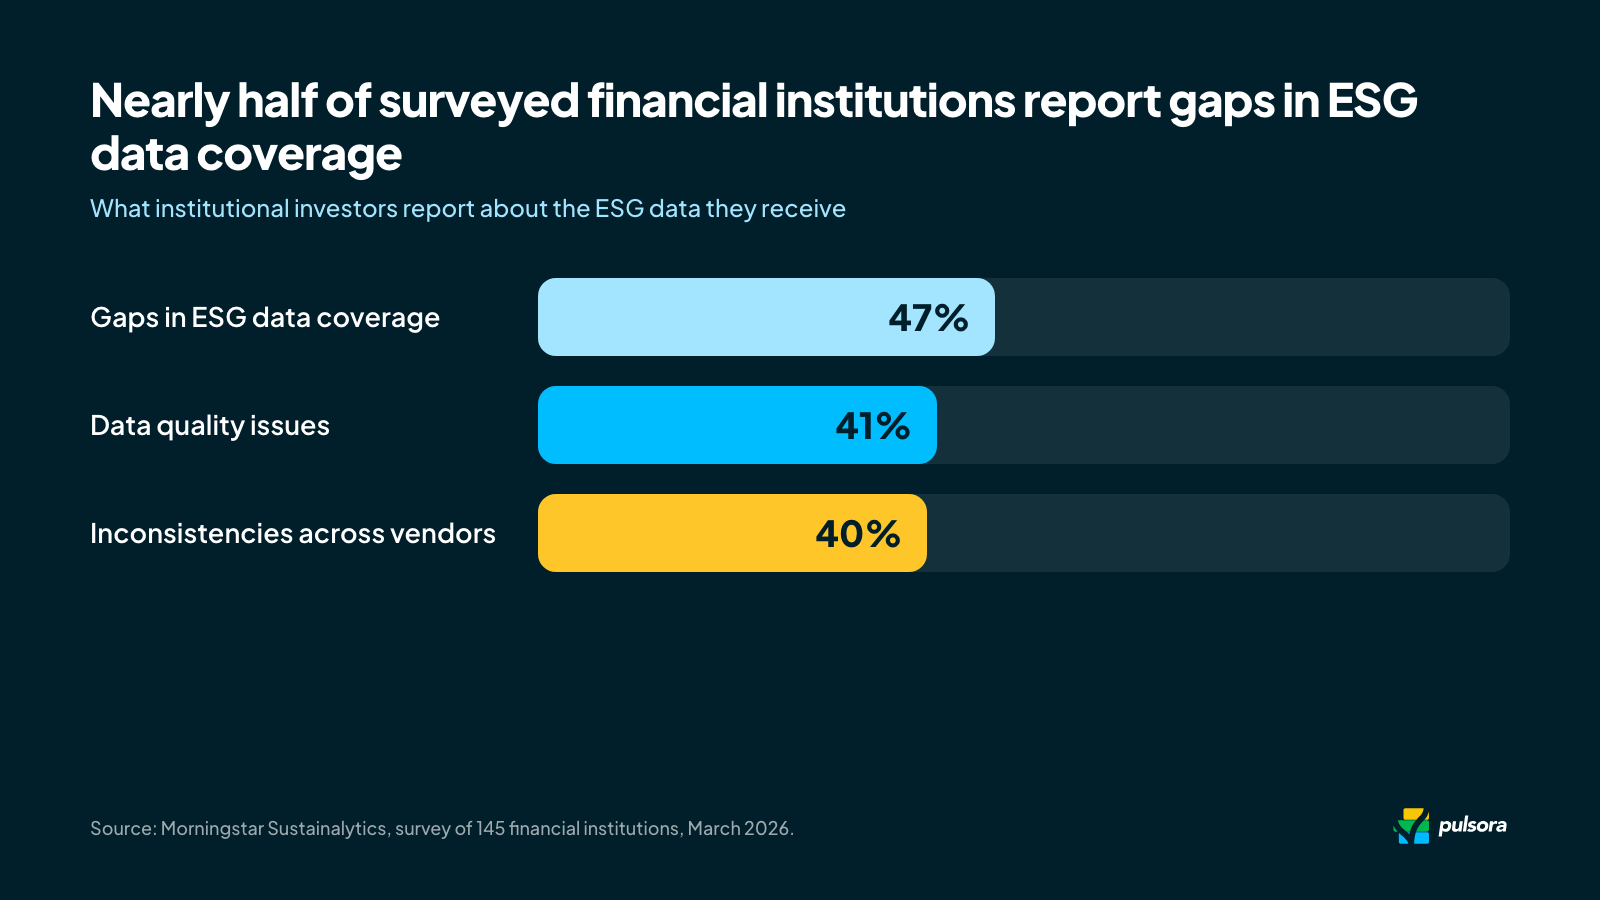
Morningstar Sustainalytics' first State of ESG Data Survey, published in March 2026, collected responses from 145 financial institutions across EMEA (Europe, the Middle East and Africa), the Americas, and APAC (Asia-Pacific). Of those, 47% cited gaps in ESG data coverage, 41% reported data quality issues, and 40% pointed to inconsistencies across data vendors [3].
The survey asks about the ESG data investors use, including data from vendors. It does not measure how investors judge any one company's disclosure.
An investor who already sees gaps in ESG data may ask where a company's own comparison came from. A comparison with a source link on every value can answer that question in the meeting.
4. Higher ESG ratings go with lower financing estimates, and fewer trust concerns go with higher shareholder returns
MSCI divided 4,319 issuers into five groups by ESG score each month from August 2015 through May 2024. MSCI's estimated financing costs (a weighted average of the cost of equity and debt) were highest for the lowest-rated group, 7.9% on average, and lowest for the top-rated group, 6.8% [4]. Higher-rated companies had lower estimates for both equity and debt, and MSCI compared companies within groups of the same home market, sector and credit quality [4]. MSCI calls this a historical correlation.
PwC's 29th Global CEO Survey, which covered 4,454 CEOs in 95 countries and territories, reports a second association. Companies with the fewest trust concerns delivered total shareholder returns over 12 months that were, on average, nine percentage points higher than companies with the most [5]. PwC restricts that comparison to the public companies in its sample. The survey's trust concerns include topics such as AI safety, data privacy, transparency and the impact of climate change on business performance [5].
Neither result shows that weak board readiness changes either measure. MSCI measures a company's ESG rating, and PwC measures trust concerns, and neither measures how prepared a board is. What the two results do show is that ESG performance and stakeholder trust are linked to financial outcomes, which may be one reason directors ask how their company compares.
5. A peer comparison prepared before the meeting answers questions that a year-end update leaves open
Consider a board update on Scope 1 and Scope 2 emissions, described here as an illustration and not as a case study.
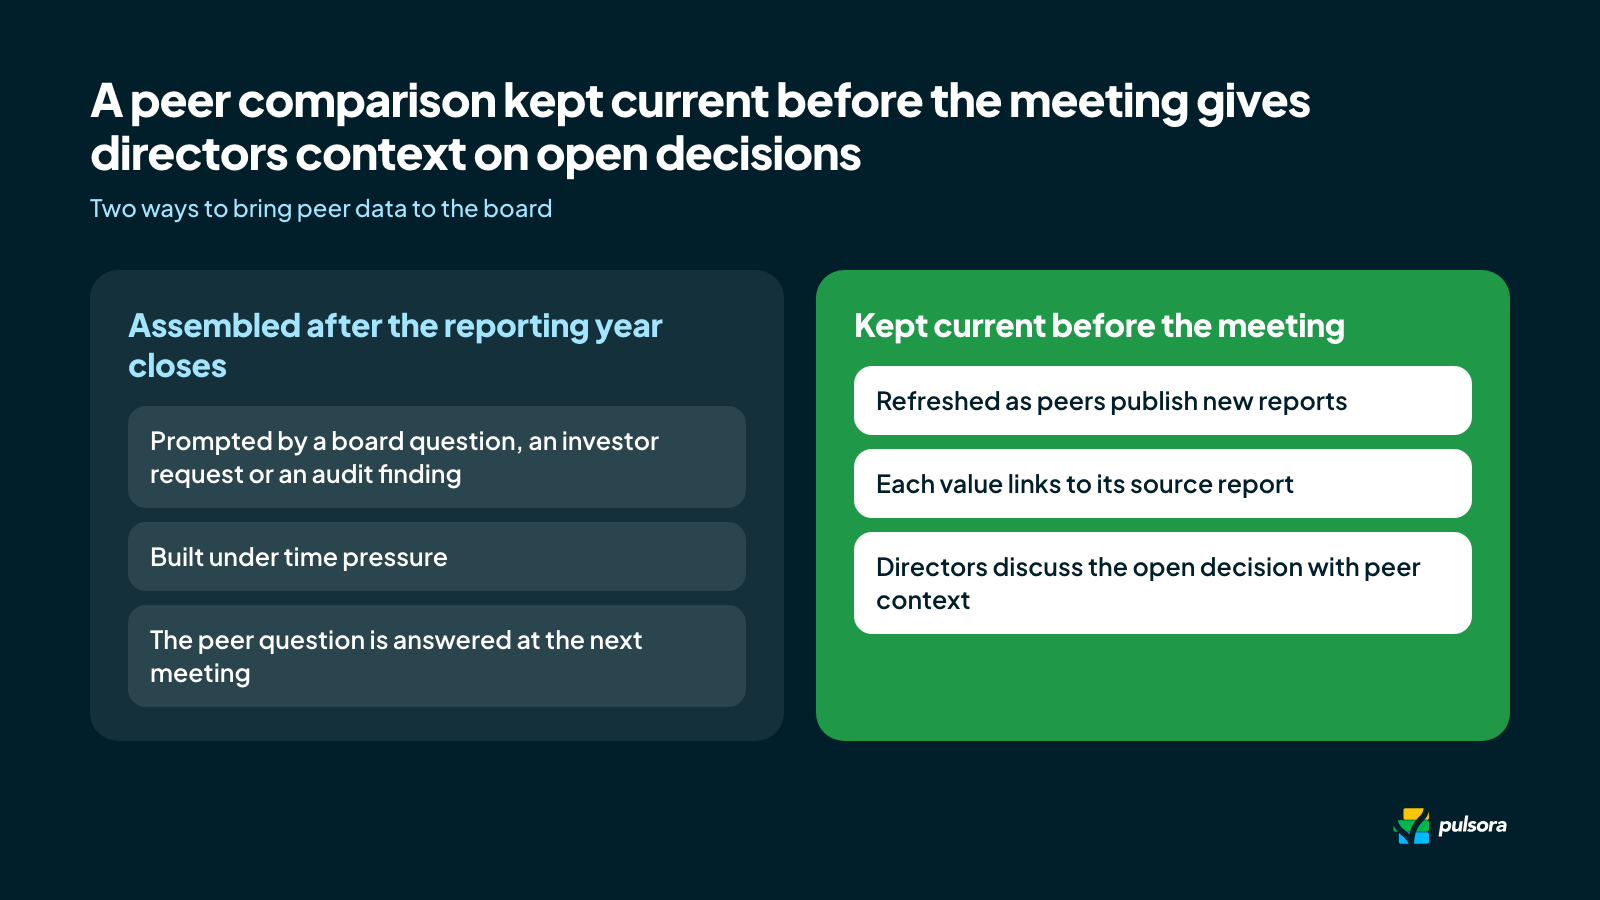
In the first version, a sustainability leader presents last year's emissions total after the reporting year has closed. A director asks how that total compares with two named competitors. The answer is a follow-up, promised for the next meeting, and the comparison gets built under time pressure once a question, an investor request or an audit finding forces it.
In the second version, the sustainability leader brings a comparison built from peers' published reports and refreshed as each peer publishes. Each value shows its unit and its year, and links to the report it came from. The board can discuss a decision that is still open, such as which reduction target to set, with peer context already on the table.
6. Reporting rules already require year-over-year comparisons, and assurance providers test them
The European Sustainability Reporting Standards (ESRS), the standards used under the Corporate Sustainability Reporting Directive (CSRD), require a company to disclose comparative information for the previous period for all metrics it discloses in the current period, except in the first year it prepares an ESRS sustainability statement [6]. The comparison in the standard is with the company's own prior year. The standard does not require a comparison with peers.
The directive requires assurance of the sustainability statement. The Omnibus I directive, published in the Official Journal on 26 February 2026 and in force since 18 March 2026, keeps limited assurance and removes the option to move to reasonable assurance [7]. Member states have until 19 March 2027 to transpose the changes. EFRAG (the European Financial Reporting Advisory Group) sent simplified versions of the standards to the European Commission in December 2025 [7], so check which text applies to your reporting year.
A peer comparison shown to a board sits outside those requirements. It still helps to build it the way an assurance provider would want a disclosed value built: with its unit, its year and a link to its source. A comparison assembled once a year under a deadline is harder to source that way.
7. Pulsora's benchmarking keeps a peer comparison current and links each value to its source
Pulsora's benchmarking capability compares a company's metrics with its peers' public disclosures [8]. The page describes the benchmark refreshing as peers publish, with each value linked to its source report, work a sustainability team would otherwise repeat by hand. Pulsora's page describes peers as found automatically from public reports [8].
Here is what the page says the capability does:
- Peer choice. You choose the companies to benchmark against, filter them by sector, and add or remove peers at any time [8].
- Metrics. Thirteen climate metrics are tracked, from Scope 1 and Scope 2 through methane intensity and flaring. Each shows its unit and its year [8].
- Views. A score heatmap and a bell curve show where a company sits. Intensity views normalize by revenue or headcount [8].
- Currency. The benchmark refreshes as peers' new disclosures are published, and the year adjusts to reporting lag [8].
- Sources. Every metric links to the source page it came from [8].
- Privacy. Your metrics are never shared with peers, published, or used to train any model [8].
Şişecam runs its sustainability reporting on Pulsora. Its customer story reports 450+ metrics standardized across 17 teams and 100 facilities, including 45 production plants in 14 countries [9]. Those metrics describe the data collection a comparison depends on. The customer story covers reporting, and it does not describe a benchmarking result.
What to do before your next board meeting
Three steps bring a peer comparison to the room before anyone asks for it:
- Pick your peers. Name the three companies your board is most likely to raise, and say why each one is on the list.
- Check what they disclose. For each peer, find where they publish your Scope 1 and Scope 2 emissions, and note the unit and the year.
- Keep the source with the value. Put a link to the peer's report next to every value, so a director or an assurance provider can trace it.
FAQ
What does board-ready ESG data mean?
In this article it means each value comes with its unit, its year and a link to the source it came from, and the comparison is current enough to answer a question asked during the meeting. A board can then discuss the result without waiting for a follow-up.
How often should a company benchmark its sustainability performance against peers?
Peers publish their reports on different dates through the year, so a comparison refreshed as each report appears stays more current than one rebuilt annually. The right interval depends on how many peers you track and when they publish.
What is the difference between reporting to the board and benchmarking for the board?
Reporting to the board presents the company's own results, usually against its own prior year. Benchmarking adds context by lining those results up with peers' published values.
How is peer benchmarking different from an ESG rating?
An ESG rating is one provider's score for a company. Peer benchmarking lines up specific metrics, such as Scope 1 and Scope 2 emissions, side by side with the source of each peer value.
What should a sustainability leader bring to a board meeting besides last year's report?
A peer comparison on the metrics the board is most likely to ask about, each with its unit, year and source link. The comparison can add peer context for open decisions, which last year's report alone does not.
Does the ESRS require a comparison with peers?
The ESRS require comparative information for the previous period, which means the company's own prior year. A peer comparison is a company's own choice, and the same sourcing discipline applies to it.
References
- Diligent and Spencer Stuart, "Nearly 96% of Board Directors Expect a Continued or Stronger Focus on ESG Despite Ongoing Backlash" (Sustainability in the Spotlight 2024), June 4, 2024. https://www.diligent.com/company/newsroom/nearly-96-of-board-directors-expect-a-continued-or-stronger-focus-on-esg
- Spencer Stuart, 2025 U.S. Spencer Stuart Board Index, October 2025. https://www.spencerstuart.com/-/media/2025/10/ssbi2025/2025-us-board-index.pdf
- Morningstar Sustainalytics, "Institutional Investors Signal Rising Demand for ESG Data Integration Amid Market Maturity" (State of ESG Data Survey), March 3, 2026. https://www.sustainalytics.com/esg-news/news-details/2026/03/03/morningstar-sustainalytics--institutional-investors-signal-rising-demand-for-esg-data-integration-amid-market-maturity
- MSCI, "MSCI ESG Ratings." https://www.msci.com/research-and-insights/paper/msci-esg-ratings-and-cost-of-capital
- PwC, 29th Global CEO Survey, "How companies can compete on trust." https://www.pwc.com/gx/en/issues/c-suite-insights/the-leadership-agenda/ceo-survey-trust.html
- European Sustainability Reporting Standards, ESRS 1 General requirements, comparative information. https://xbrl.efrag.org/e-esrs/esrs-set1-2023.html
- Deloitte, "European Sustainability Reporting: Omnibus Legislative Update and ESRS Updates," Heads Up, 2026. https://dart.deloitte.com/USDART/home/publications/deloitte/heads-up/2026/eu-sustainability-reporting-omnibus-esrs-updates
- Pulsora, Benchmarking. https://www.pulsora.com/platform/benchmarking
- Pulsora, "Şişecam: 450 metrics across 17 teams and 100 distinct facilities." https://www.pulsora.com/customers/sisecam-pulsora


